


Top Dogs @ 4 weeks of baseball!
Hi everyone,
Just a quick note to everyone to share some stats now that the MLB season is 4 weeks old (is it just me or is it going really fast?).
We’ve had a nice profitable Week 4, so I’m sharing some data visualizations of that, along with our first 3 weeks (a bit lower down, after I finish blabbering about data…).
After yesterday’s games, our season unit balance was sitting at 143.45 units. That’s profit. The system has recommended 1,206 units over that time, so that gives us a season ROI of +11.89% so far.
If you’ve been using $1 units, you’re up $143
If you’ve been using $10 units, you’re up $1,430
If you’re using $100 units, you’d be up $14,300
If you’re using… well you get the idea.
I always like to look at the *highest* number of units bet in any single day because I like to see how much our balance is over the *most* spent in a day.
Currently, that highest daily unit number is 99 units. Our balance is at $143, so we’re 44 units above our highest daily spend. That feels good, to me. :)
Tables and Graphs, 4 weeks in!

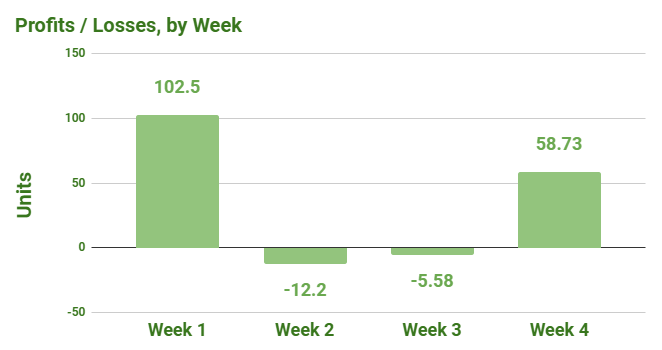
Units, profits and losses:

ROI:
Now, Return on Investment is one of my favorite stats with any system, because it tells you in one number how well the system is doing. This is why I share it (and maybe why other systems don’t? When I look at other systems, I always have a hard time finding detailed performance data and ROI).
Ideally, most of our baseball season (and hockey and basketball in the fall/winter) will look like the below chart - high increases some weeks, with low decreases when we have a bad week.

That’s it for this update.
See you all tomorrow.