


Top Dogs: Historical Performance Data
Checking our capping and staking with historical data
Hi everyone,
Since I re-weighted the multiple capping and, more significantly, the multiple staking models that make up the Top Dogs system on June 10, I’ve been adjusting it slightly and extrapolating the data backwards to check performance.
The results are very good. You can find them below.
I’m sharing with you today (both premium and free subscribers) the historical data and performance from both this MLB season and the 2018 MLB season using this new capping and staking. We’ll be continuing with this for the remainder of the season and into hockey and basketball seasons, as it keeps unit spends relatively low while taking advantage of underdog wins to make a profit.
I’ll go back even further to previous MLB seasons (and will share the results as they are ready) and I’m in the midst of testing this with the most recent seasons of the NHL and NBA and making small hockey-specific and basketball-specific adjustments.
Things I will add to this post (they’ll be added to the website, and I’ll let you know when I do):
More MLB seasons going back into the past
2018-19 NHL performance (as well as previous years)
2018-19 NBA performance (as well as previous years)
Game by game and unit records (probably links to Google Sheets so you can download and check things yourselves if you want to)
2019 MLB Season
If we used the current system starting at the beginning of the season, here are what our stats and graphs would look like:
(these graphs are current up to and including July 2, 2019)

So, even with underdogs winning at a significantly lower rate so far this baseball season (compared to 2018), still positive returns. The early May losing streak is evident here (the big downwards dip), but things recovered fairly quickly, with daily unit spends staying under 100 units. The unit balance at this point would be around +50ish, with daily unit spends in the 5-10 range.

Here’s a histogram of 2019 daily spends so far, to give you an idea of that breakdown - obviously, a majority of days had sub-10 unit spends, with a fair chunk between the 10-20 ranges. A few days above that as well. I’m still recommending a 1000 unit bankroll, as these are still underdogs, after all, even though we wouldn’t have broken 100 units in a day.

Here’s cumulative ROI for 2019 so far - after some wild swings earlier in the season, it’s settled down into the 4-5% range for the last 6 weeks or so.
2018 MLB Season
How this capping and staking system performed in the 2018 MLB Season:
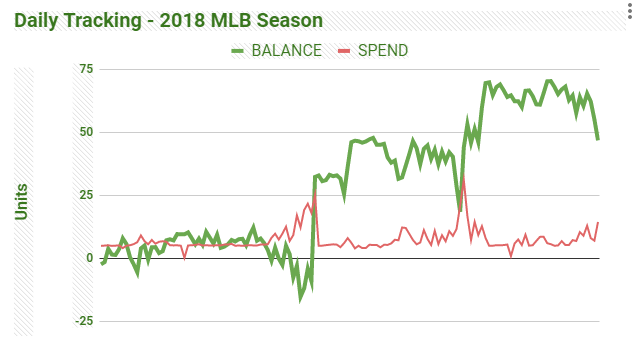
This did fairly well in 2018. You can see that the daily unit spends barely broke 30 units (more on this below) but the unit balance increased steadily throughout the season, even with the ups and downs of sports betting.

This “Spend” histogram looks a bit different from 2019, as it had generally lower daily spends, with most of them being sub-5 and sub-10 units. The maximum daily spend was just over 30 units.

Cumulative ROI in 2018 for the MLB wasn’t as up and down as 2019 (aside from the beginning of the year, and for the entire 2nd half of the season settled down and cruised along in the 5-7% range, mostly.
Still to Come:
More MLB seasons going back into the past
2018-19 NHL performance (as well as previous years)
2018-19 NBA performance (as well as previous years)
Game by game and unit records (probably links to Google Sheets so you can download and check things yourselves if you want to)
If you have any questions about anything above, please hit reply to this email (or comment below if you are reading this on the website).