


Top Dogs: Sunday Statistics Post - Sun, Apr. 14, 2019
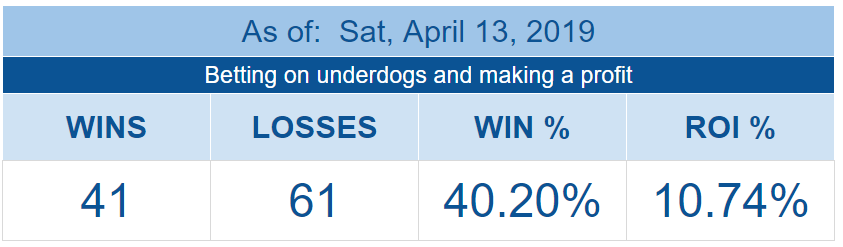
2 weeks into the season with a +10.74% ROI
Hi everyone,
Welcome to our 2nd Sunday Statistic post.
These will get larger as the MLB season progresses (and we get into the NHL and the NBA in the fall), and is basically where I’ll post more detailed statistics that I’ll keep out of the daily email to keep those ones fairly short.
Overall Stats:
It’s good to see how we’re doing overall. When I tested this system using the 2018 MLB season, the ROI hovered around 10% (with obvious fluctuations as underdogs had mini-winning and losing streaks), so I expect the same will happen this year.
The Daily Graphs:
These are the ones I include in every email:
TABLES: Spends, Profit/Loss, ROI:
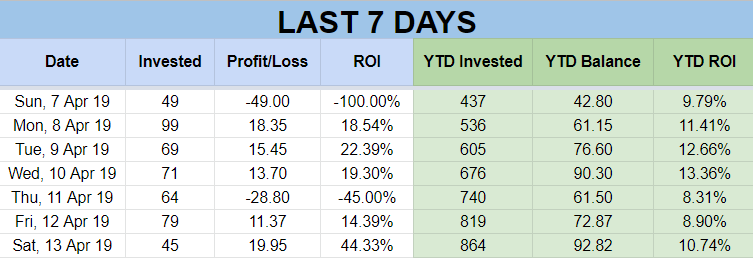

GRAPH: Overall Unit Balance vs Daily Units Spent:

GRAPH: Daily Unit Profit or Loss:

GRAPH: Daily Return on Investment %:

Extra Graphs not in the Daily Email:
Still developing these, and will add more as the MLB season progresses (and as baseball ends and hockey and basketball seasons start), so we can see more and more data of what is happening over the long term.
Weekly Performance:
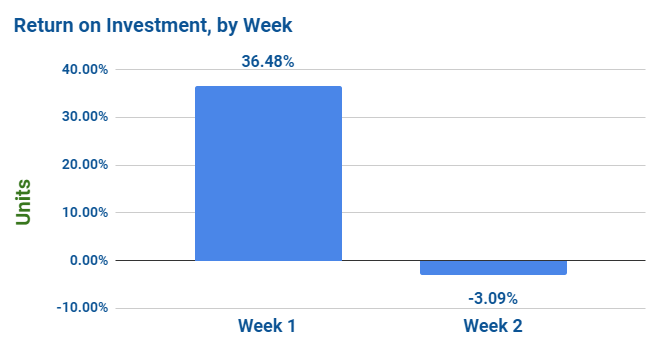
Now that we’re over 2 weeks into baseball, we can start compiling how our system is doing week to week instead of just day to day.
First up, a simple bar chart showing our very good Week 1, with our not very good Week 2 (but we kept losses to a minimum in Week 2).

Next, the same thing, but in a “Waterfall Chart” format, which are handy for seeing gains vs losses and how they make up the total.

And here’s Return on Investment, by week:
Team Performance:
I’ve started looking at how each team has been performing for us, and I’ve included tables below that show how much profit (or loss) we’ve made from each team.
Generally, if a team is constantly construed as an underdog but starts winning more games than expected (oh hello there Baltimore), they’ll have a good showing here. Now, Baltimore has only won 6 of the 13 games we’ve bet on them, but their lines have been so high (close or over 3.00 in many games), those 6 wins have given us a 64.32% ROI on Baltimore.
Likewise, sometimes a really good team like Philly has a crazy high line on them and they end up winning the game (Philly has only been a big enough underdog once so far - on April 2, when they beat the Nationals 8-2) and we have a huge 180% ROI on them.
Here are our profitable teams (so far), ranked by ROI%.

and, here’s the same table but for teams with negative ROI for us (so far):

If you don’t see your favorite team on either of these lists, don’t worry - they’ll eventually show up (unless they do extremely well this year and are never considered a big underdog.
Future Graphs:
I have a few more interesting graphs planned for future editions of this Sunday Stats post:
Longer term data, as we get to the 30, 60, and 90-day marks of the MLB season
Season long trends (for instance, for the 6 big underdogs we bet on every day, how often does it happen that none win? That only 1 wins? 2? 4? ALL?)
Line data - I’m very interested in exploring this… this will ideally show, at every betting line, how much we’ve bet, won or lost, etc. with this system
Basketball & Hockey
As the baseball season progresses and we get closer to the fall, Top Dogs will have basketball and hockey stuff here… I’ve been collecting all kinds of data during the 2018-19 hockey and basketball seasons and am developing some great systems for them (so we can continue our profit-making in the baseball off-season). I’ll be sharing a lot of analysis and results from my testing.
See you tomorrow. Have a great Sunday.