


Top Dogs: Sunday Stats - Sun, May 12, 2019
A rough week
Hi everyone,
Welcome to weekly Sunday Statistics Post.
Yesterday was profitable, but before that we just completed a bad losing streak of 9 days without profit (the longest stretch like that in 2018 was only 4 days, and it only happened once).
Betting on underdogs mean losing streaks sometimes. I implemented some unit conservation strategies when we were 7 days into the streak, which stemmed unit losses (our balance would be far lower than it is without that), and some recovery strategies that couple low unit spends with some aggressive features should get us back to positive territory in not too long. It depends what our Top Dogs do.
You’ll see a new graph below that shows what the Dogs are doing each day so far this season.
I’m pretty adamant that people shouldn’t follow most systems or cappers because they obscure data, not showing a complete record of their wins and losses. I’ve worked in data analysis for 20+ years, so I’m a big proponent about being honest about the data. Winning or losing streaks, anyone that follows this system (or is thinking about it) should know exactly what’s going on.
Anyway, on to our weekly stats!
Overall Stats:
It’s good to see how we’re doing overall. When I tested this system using the 2018 MLB season, the ROI hovered around 10% (with obvious fluctuations as underdogs had mini-winning and losing streaks), so I expect the same will happen this year, even with this big losing streak.

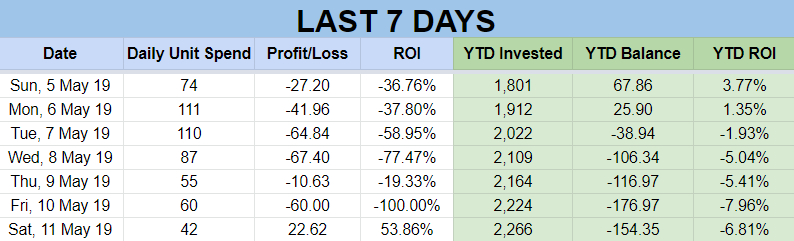
TABLES: Spends, Profit/Loss, ROI:
How the system has done the past 7 days, as well as our year-to-date totals for invested, unit balance, and ROI:
It’s good to look longer term, so this table shows rolling totals for the last few 30-day periods:

WEEKLY DATA
What a Week 6. Woah.

Units, profits and losses:

Next, the same thing, but in a “Waterfall Chart” format, which are handy for seeing gains vs losses and how they make up the total.

ROI:
Now, Return on Investment is one of my favorite stats with any system, because it tells you in one number how well the system is doing. This is why I share it (and maybe why other systems don’t? When I look at other systems, I always have a hard time finding detailed performance data and ROI).

NUMBERS OF WINS EACH DAY:
Here’s our new graph this week - more of a table-graph hybrid, I guess.
It shows how often we get different numbers of wins from our 6 underdogs.

So, even with our 9 day losing streak, which was mostly 0 and 1 win days, most of our days (62%) have 2 or 3 wins.
2 wins usually means a small loss on the day (but sometimes it means a profit if the staking is right), and 3 wins is almost always a profit.
It’s good to see that 73% of the time, we have at least 2 wins.
I’ll work on some more graphs with this data.
Future Graphs:
I have a few more interesting graphs planned for future editions of this Sunday Stats post:
Longer term data, as we get to the 60, and 90-day marks of the MLB season
Basketball & Hockey
As the baseball season progresses and we get closer to the fall, Top Dogs will have basketball and hockey stuff here… I’ve been collecting all kinds of data during the 2018-19 hockey and basketball seasons and am developing some great systems for them (so we can continue our profit-making in the baseball off-season). I’ll be sharing a lot of analysis and results from my testing.
See you next Sunday (or tomorrow morning if you’re a subscriber).