


Top Dogs: Sunday Stats - Sun, May 19, 2019
On the road to recovery
Hi everyone,
Welcome to the weekly Sunday Statistics Post.
We’ve now had 8 days since the big losing streak ended, and I’m happy to report that we’re back to our roughly +10% ROI.
I’ve added some unit conservation techniques (to keep unit loss low in any future losing streaks) as well as some elements of aggression to capitalize a bit more on individual team wins we may have to help get our overall season unit balance back up again (yesterday is a good example of this - these techniques told me that a few more units could go on CIN and PIT and it worked out as they both pulled out wins, so even though only 2 of our 6 dogs won, we still made +10% ROI on the day).
You’ll see a new graph below that shows what the Dogs are doing each day so far this season.
I’m pretty adamant that people shouldn’t follow most systems or cappers because they obscure data, not showing a complete record of their wins and losses. I’ve worked in data analysis for 20+ years, so I’m a big proponent about being honest about the data. Winning or losing streaks, anyone that follows this system (or is thinking about it) should know exactly what’s going on.
Anyway, on to our weekly stats!
Overall Stats:
It’s good to see how we’re doing overall. When I tested this system using the 2018 MLB season, the ROI hovered around 10% (with obvious fluctuations as underdogs had mini-winning and losing streaks), so I expect the same will happen this year, even with this big losing streak.
We were cruising along at around 10% ROI before the losing streak, and have a 10.20% ROI in the 8 days since. Some new unit conservation techniques I’ve added to the system will limit any big unit losses if we hit another big losing streak.

TABLES: Spends, Profit/Loss, ROI:
We’ve now had 8 days since the big losing streak, and it’s starting to show up in the stats. The last 2 days in the table below are back in positive ROI territory.

And here’s our daily performance for the past week. A couple poor days, but overall pretty good.

Our 30-day rolling totals table. Always good to see how things are working out long-term, even when things have been rough.
This will look pretty bad until we put some distance between us and our big losing streak. In 22 days, these numbers will start to look better. :)

WEEKLY DATA
Week 7 included the tail end of the losing streak.
Week 8 (so far) is looking good - Thurs, Fri, and Sat stats are 161 units invested for a 32.97 unit profit (or an ROI of 20.48%.


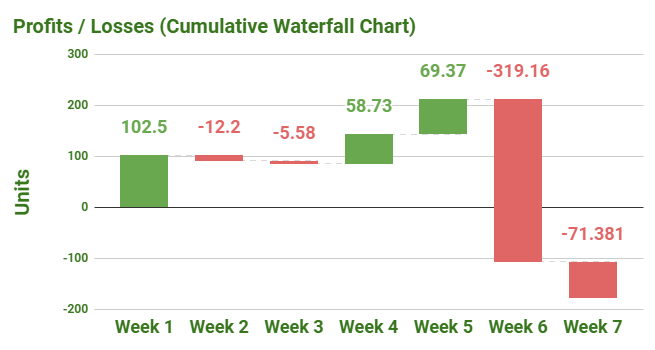
Units, profits and losses:

Next, the same thing, but in a “Waterfall Chart” format, which are handy for seeing gains vs losses and how they make up the total.
ROI:
Now, Return on Investment is one of my favorite stats with any system, because it tells you in one number how well the system is doing. This is why I share it (and maybe why other systems don’t? When I look at other systems, I always have a hard time finding detailed performance data and ROI).

NUMBERS OF WINS EACH DAY:
I’ve updated our new graph for this week - more of a table-graph hybrid, I guess.
It shows how often we get different numbers of wins from our 6 underdogs.

So, even with our 9 day losing streak, which was mostly 0 and 1 win days, almost 3/4 (74%) of the days so far this MLB season have had wins by at least 2 of the biggest 6 underdogs.
2 wins usually means a small loss on the day (but sometimes it means a profit if the staking is right, like yesterday), and 3 wins is almost always a profit.
Future Graphs:
I have a few more interesting graphs planned for future editions of this Sunday Stats post:
Longer term data, as we get to the 60, and 90-day marks of the MLB season
Basketball & Hockey
As the baseball season progresses and we get closer to the fall, Top Dogs will have basketball and hockey stuff here… I’ve been collecting all kinds of data during the 2018-19 hockey and basketball seasons and am developing some great systems for them (so we can continue our profit-making in the baseball off-season). I’ll be sharing a lot of analysis and results from my testing.
See you next Sunday (or tomorrow morning if you’re a subscriber).
OTHER SYSTEMS
I’ll be populating this section with other systems I’m recommending or testing.
COMING SOON: 4 Big Dogs
(I’ve been testing this system since the start of the 2018 MLB season, and it’s been preforming *very* well… even through the big losing streak the big underdogs had in the first week of May of this year, which is making me think I may be ready to share it with others.)
One Fave Per Day (Testing Phase, 100% Free)
https://onefavedaily.substack.com/
I have a lot of systems for both underdogs and faves (and other methods) in development and testing. Here’s one of them that focuses on 1 fave per day.
It’s free to subscribe and get one fave pick every morning in your email.
