


Top Dogs: Sunday Stats - Sun, Apr. 28, 2019
1 month into baseball and we're up +160 units
Hi everyone,
Welcome to weekly Sunday Statistics Post.
We’re now just over a month into the baseball season, and if you saw our Top Dogs @ 4 Weeks of MLB email earlier this week, you’ll know the Top Dogs system is doing very well so far.
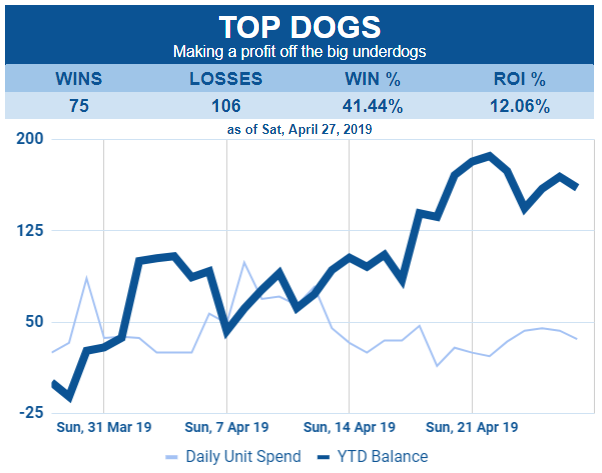
After yesterday’s games, our season unit balance was sitting at 160.38 units.
The system has recommended 1,330 units over that time (it’s up to you what your unit value is, depending on your finances and risk tolerance level), so that gives us a season ROI of +12.06% so far.
If you’ve been using $1 units, you’re up $160
If you’ve been using $10 units, you’re up $1,600
If you’re using $100 units, you’d be up $16.000
If you’re using… well you get the idea.
Pretty good for 1 month of 6 games per day.
Anyway, on to our weekly stats!
Overall Stats:
It’s good to see how we’re doing overall. When I tested this system using the 2018 MLB season, the ROI hovered around 10% (with obvious fluctuations as underdogs had mini-winning and losing streaks), so I expect the same will happen this year.
TABLES: Spends, Profit/Loss, ROI:
How the system has done the past 7 days, as well as our year-to-date totals for invested, unit balance, and ROI:

It’s good to look longer term, so this table shows rolling totals for the last few 14-day periods:

Here’s a new table now that we’re 30 days into the season. I’ll include both the 14 day table (above) as well as the 30 day one for a while, but eventually will just have the monthly to show long term performance…
GRAPHS: Overall Unit Balance vs Daily Units Spent:
Since the start of the MLB season:

GRAPHS: Daily Unit Profit or Loss:
Waterfall chart of the season:

GRAPHS: Daily Return on Investment %:
Last 7 Days, and our season ROI as the season progresses:

Extra Graphs not in the Daily Email:
Still developing these, and will add more as the MLB season progresses (and as baseball ends and hockey and basketball seasons start), so we can see more and more data of what is happening over the long term.
Weekly Performance:
Now that we’re over 4 weeks into baseball, let’s compile how our system is doing week to week instead of just day to day. I’ll eventually be adding monthly summaries to this section.
We had a good week 4:

Units, profits and losses:
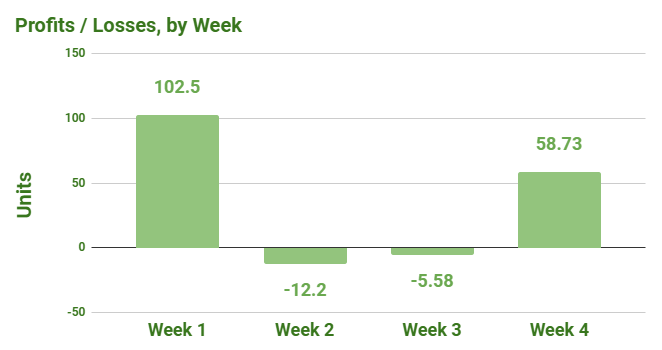
Next, the same thing, but in a “Waterfall Chart” format, which are handy for seeing gains vs losses and how they make up the total.

ROI:
Now, Return on Investment is one of my favorite stats with any system, because it tells you in one number how well the system is doing. This is why I share it (and maybe why other systems don’t? When I look at other systems, I always have a hard time finding detailed performance data and ROI).
Ideally, most of our baseball season (and hockey and basketball in the fall/winter) will look like the below chart - high increases some weeks, with low decreases when we have a bad week.

Team Performance:
How is each MLB team performing for us?
I’ve included tables below that show how much profit (or loss) we’ve made from each team.
16 of the 30 MLB teams have given us a positive ROI so far this season, while 11 have negative ROI so far. There are only 3 teams that we haven’t bet on yet: Cleveland, the Astros, and the Dodgers.
Here are our profitable teams (so far), ranked by ROI%.

And, here’s the same table but for teams with negative ROI for us (so far):

Future Graphs:
I have a few more interesting graphs planned for future editions of this Sunday Stats post:
Longer term data, as we get to the 60, and 90-day marks of the MLB season
Season long trends (for instance, for the 6 big underdogs we bet on every day, how often does it happen that none win? That only 1 wins? 2? 4? ALL?)
Line data - I’m very interested in exploring this… this will ideally show, at every betting line, how much we’ve bet, won or lost, etc. with this system
Basketball & Hockey
As the baseball season progresses and we get closer to the fall, Top Dogs will have basketball and hockey stuff here… I’ve been collecting all kinds of data during the 2018-19 hockey and basketball seasons and am developing some great systems for them (so we can continue our profit-making in the baseball off-season). I’ll be sharing a lot of analysis and results from my testing.
See you next Sunday (or tomorrow morning if you’re a subscriber).