


Top Dogs: Sunday Stats - Sun, July 7, 2019
Hi everyone,
Welcome to the weekly Sunday Statistics Post.
This system has settled down since June 10 when I re-weighted the multiple capping and staking models I combine for this system.
Stats up to June 9, 2019 (old weighting)
Here are our performance ROIs from today’s daily email:
Yesterday’s ROI: +0.80%
Last 7 days ROI: +2.25%
Last 14 days ROI: +1.60%
Since June 10 (27 days): +4.79%
Last 30 days ROI: -4.06%
2019 MLB Season ROI: -6.21%
Anyway - on to the stats!
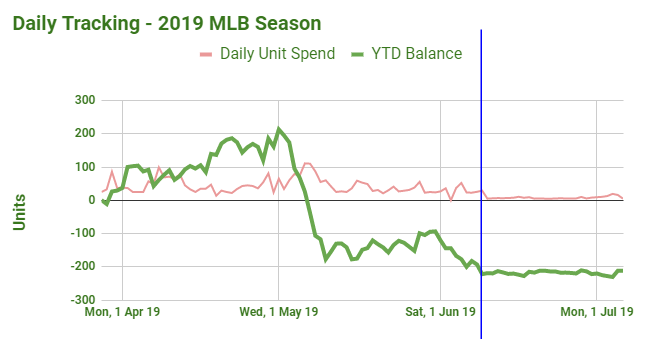
SEASON GRAPH AND STATS:
If we had been using the post-June 10th weighting from the start of the season, our season graph would look like this (you can see this post for more performance data):
The blue line is June 10th, the start point of our new weighting for capping and staking:
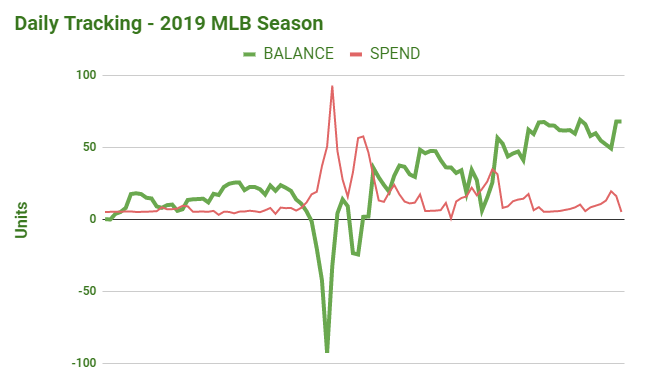
WEEKLY DATA
Recent 7-day period numbers:

Units, profits and losses:

Next, the same thing, but in a “Waterfall Chart” format, which are handy for seeing gains vs losses and how they make up the total.

ROI:

Basketball & Hockey
As the baseball season progresses and we get closer to the fall, Top Dogs will have basketball and hockey stuff here… I’ve been collecting all kinds of data during the 2018-19 hockey and basketball seasons and am developing some great systems for them (so we can continue our profit-making in the baseball off-season). I’ll be sharing a lot of analysis and results from my testing.
See you next Sunday (or tomorrow morning if you’re a subscriber).
OTHER SYSTEMS
I’ll be populating this section with other systems I’m recommending or testing.

